"A couple of other software providers I looked at didn’t have the same functionality...I always felt like I got an answer and somebody to walk me through it and to get back to me quickly, which I really appreciated."
FY26 K-12 Funding: Uncertainty as a Structural Reality
Complexity has always been part of K-12 funding. For districts planning for FY26, that complexity now feels embedded in the system itself. Funding decisions increasingly depend on shifting timelines, evolving eligibility rules, and implementation requirements that can change mid-cycle.
District leaders continue to ask familiar questions:
When will funds be released?
What conditions will govern their use?
How stable are allocations across fiscal years?
Those questions now sit alongside a broader national concern. A recent report found that 42 states allocated a smaller percentage of their budgets to K-12 education in FY22-23 than they did two decades earlier. In that environment, identifying and securing diverse funding streams has become a core part of district planning.
Federal Movement: Incremental but Impactful
Recent federal action has added new variables to the FY26 planning horizon.
Legislation signed into law provides $79 billion for the U.S. Department of Education from February through September, including an increase of approximately $217 million over projected FY25 levels, according to K-12 Dive. States and districts are still required to submit formula grant proposals at congressionally mandated levels, even as discussions continue around shifting some education responsibilities to other federal agencies.
The Department of Education has also outlined how some of these changes may move forward. In a recent press release, Education Secretary Linda McMahon confirmed that interagency agreements had been established to coordinate program delivery and administration. Even modest governance changes can affect reporting requirements, compliance expectations, and the timing of allocations.
Operational changes at the Department have added another layer of uncertainty. Data collection tied to student outcomes, workforce trends, and high school performance remains under review following workforce reductions earlier this year. Concerns have already been raised about the long-term reliability of federal education datasets used by states and districts for planning and policy decisions.
At the same time, legislation such as the Kids Internet and Digital Safety Act continues to move through Congress, reflecting the growing policy focus on digital safety, social media, and AI tools used by minors.
Contextual Risk Signals
Recent developments illustrate how quickly funding conditions can change.
$6.2 billion in federal K-12 funding for FY25 was temporarily withheld in July 2025
That amount represented approximately 14.4% of the prior-year Department of Education budget
The delay forced districts to revisit staffing, program rollouts, and multi-year planning assumptions
Legal challenges are also shaping the landscape. Lawsuits in Wisconsin, Kentucky, New Hampshire, and Wyoming have all centered-on funding adequacy and the way formulas respond to inflation and student need.
Funding disparities remain significant across the country. Research indicates that two-thirds of students living in chronically underfunded states are concentrated in just ten states, while the Albert Shanker Institute estimates that K-12 schools lost nearly $600 billion in state and local funding between 2016 and 2023.
Infrastructure Pressures Remain Elevated
Volatility in school finance exists alongside long-term infrastructure pressure.
The State of Our Schools 2025 report ranks K-12 education second only to highways in total public infrastructure capital spending nationwide. Much of that investment is financed through long-term debt repaid through district operating budgets.
Federal disaster relief helps, but it remains reactive rather than preventive. Between FY13 and FY23, FEMA awarded nearly $13 billion to school districts for disaster recovery. That funding addresses only part of the need. Schools still require ongoing investment in facilities modernization, HVAC replacement, safety upgrades, technology infrastructure, and compliance-related renovations.
Spending Growth and Expanded Expectations
Total K-12 spending has increased over time, even as funding flexibility remains limited.
Long-Term Funding Trends (2002–2023)
Public K-12 funding increased 35.8%
Total nationwide spending reached $946.5 billion in 2023
Those increases have coincided with expanded expectations around campus safety, mental health supports, cybersecurity, instructional technology, and reporting requirements. Many allocations remain restricted, time-bound, or tied to specific initiatives.
Mental health services are one example. The American School Counselor Association reports that the national student-to-counselor ratio now averages 372-to-1, giving roughly 529,000 additional students access to counseling services nationwide. That matters not only for student wellness, but also for school safety planning, particularly in Behavioral Threat Assessment programs.
Planning in a Persistent State of Flux
Uncertainty in K-12 finance has shifted from periodic disruption to a continuing operating condition.
District leaders preparing for FY26 are increasingly focused on:
diversified funding strategies
scenario-based budgeting
early identification of grant opportunities
multi-year forecasting that accounts for timing risk
alignment between operational priorities and eligible funding categories
Districts that treat uncertainty as a planning assumption rather than an exception are better positioned to absorb delays, policy changes, and allocation shifts.
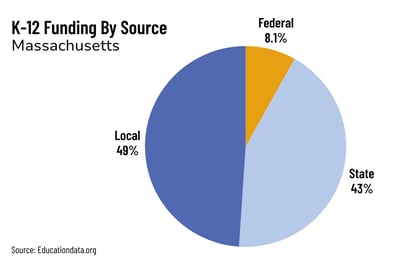
Grant Finder State Spotlight: Massachusetts
According to the latest financial data available, Massachusetts invests approximately $16 billion annually in K–12 education. That equates to roughly $24,907 per pupil in total funding and $22,947 per pupil in spending.
The statewide funding mix is as follows:
Federal funding: 8.09%, or $1,856 per pupil
State funding: 42.96%, or $9,851 per pupil
Local funding: 48.95%, or $11,226 per pupil
Massachusetts relies primarily on state and local dollars rather than federal funds. Nationally, federal funding averages about 13.6% of total K-12 funding per state. In Massachusetts, it is just over 8%.
That funding structure helps explain why Massachusetts ranks 12th nationally in overall funding and 6th in spending. In 2021, schools in the Commonwealth received approximately $5,400 more per student than the national average.
From a taxpayer perspective, roughly 3.40% of taxpayer income is dedicated to education, with state and local contributions doing most of the heavy lifting.
How K-12 Funding Works in Massachusetts?
Public K-12 funding in Massachusetts is structured as a partnership between local municipalities and the state government. Federal funding contributes a relatively small portion of the total.
The primary state aid mechanism is Chapter 70, which is designed to promote equity and adequacy across districts. The formula is built to:
ensure every district receives a minimum level of per-student funding through the Foundation Budget
adjust funding based on local wealth so lower-income communities receive more state support
The Foundation Budget establishes the minimum spending level required to provide an adequate education. It is calculated using:
prior-year October enrollment
grade-level spending assumptions
student characteristics such as special education status, English learner status, and low-income indicators
It also estimates the cost of major operating areas, including administration, staffing, instructional materials, technology, and student support services.
The Student Opportunity Act
Massachusetts updated Chapter 70 through the Student Opportunity Act (SOA) in 2019. The law launched a six-year implementation phase, and the state is currently in the fifth year of that rollout.
The SOA increased funding with a focus on higher-need districts and achievement gap reduction.
The Chapter 70 formula has three core parts:
Foundation Budget The minimum amount each district should spend to provide an adequate education.
Required Local Contribution (RLC) The amount each municipality is expected to contribute based on property values and local income.
Chapter 70 Aid The difference between the Foundation Budget and the Required Local Contribution, paid by the state.
For FY26, the minimum Chapter 70 aid increase is set at $150 per pupil, an increase of $46 from FY25.
Massachusetts also supplements this system through mechanisms such as the Fair Share surtax and the Special Education Circuit Breaker, both of which help districts manage high-cost priorities.
The Role of Local Revenue
Local funding accounts for approximately 50% to 55% of total K-12 revenue in Massachusetts.
A statewide Property Tax Cap generally limits levy growth to around 2.5% annually. This cap protects taxpayers, but it can also create pressure when healthcare, utilities, transportation, or staffing costs rise faster than local revenue growth. In those cases, districts become more dependent on state aid to close budget gaps.
Case Study: A K-12 School Funding Comparison
If we look at three different towns in Massachusetts – Lowell, Braintree, and Cambridge – we can see where and how the funding formula works for FY26, which was agreed and signed by the Governor in July 2025. For the purposes of this exercise, these numbers are based on data available in the DESE's website.
Lowell is a Gateway City, which means it receives the majority of its K-12 school funding from the state. Braintree and Cambridge fall into the Wealthy/High Revenue category. When we compare the per-pupil expenditure between each of these towns in FY26, we can see that there is a disparity between the three:
District
Total Enrollment (est)
Per-Pupil Spending
Cambridge
7,558
$39,500
Lowell
14,100
$20,400
Braintree
5,600
$18,850
When we add the K-12 school funding figures via the Foundation Budget and the Chapter 70 program, then the minimum cost to provide the aforementioned adequate education for all students becomes clearer:
District
Foundation Budget
Chapter 70 State Aid
Cambridge
$108.7 million
$21.4 million
Lowell
$352.4 million
$258.1 million
Braintree
$85.2 million
$20.6 million
In Massachusetts, there is also the requirement to provide details of Net School Spending (NSS). This is the total amount that a district spends on its schools from local and state sources, excluding federal grants and capital costs.
In addition, state law says that every K-12 school district must meet or try to adhere to a Required NSS. Simply put, this is the Foundation Budget, but some cities or towns choose to spend more. Again, this can create disparities in education and opportunity.
Cambridge (which has an excellent reputation locally for its public schools) is notorious for spending above its requirements, thanks to a high property tax base and resident income. In fact, the city funds over 90% of its schools through local revenue – around $35,000 per pupil, roughly double the state average.
District
Required NSS
Estimated Actual NSS
% Over Requirement
Cambridge
$108.7 million
$280.2 million
157%
Lowell
$352.4 million
$361 million
2.5%
Braintree
$85.2 million
$105.4 million
24%
When you take all of these numbers from three different districts into account, there are two reasons for the disparities in one single state:
Wealthy districts can use their high property values to (essentially) spend whatever they want
Middle/lower income districts struggle to even meet the 2.5% threshold, due to local property tax caps and a lack of non-residential tax revenue
The Census Bureau does publish full federal, state, and local revenue totals for K-12 schools in Massachusetts (and every other state), which is another resource for school administrators. These reports can be found in the Annual Survey of School System Finances, which includes:
Revenues by source (federal, state, local)
Expenditure
Assets, debt, and more
To find out more about the data available and how it underpins the K-12 school funding ecosystem, click here for the official website.
Where School Safety Fits In
The expiration of ESSER funding has increased pressure on districts to maintain technology infrastructure and safety initiatives without federal relief dollars.
According to the SETDA 2025 State EdTech Trends Report:
funding remains the largest unmet need for school districts
only 6% of districts expect to sustain initiatives previously funded by ESSER
top technology priorities include:
Artificial Intelligence (17%)
Cybersecurity (16%)
Broadband infrastructure (16%)
School safety planning now sits alongside technology modernization, cybersecurity readiness, and student support services. For Massachusetts districts, grants and alternative funding pathways are becoming more important to long-term planning.
Grant Finder: Federal Opportunities
Several federal programs remain relevant for Massachusetts districts entering FY26, even as application windows and oversight structures continue to evolve.
Key programs include:
DOJ STOP Grant
Due Date: Currently closed, will reopen in 2026
Eligibility: Public, private, and charter K-12 schools
Description: Provides funding to prevent and reduce school violence by implementing training, developing school threat assessment teams and/or intervention teams to identify violence risks, introducing technologies like anonymous reporting tools, or applying other school safety strategies that assist in preventing violence. The goal is to equip K–12 students, teachers, and staff with tools to recognize, respond to, and prevent acts of violence.
COPS SVPP Grant
Due Date: Currently closed, will open again in 2026
Eligibility: School districts (including public charter schools and school districts with a single school), school boards, law enforcement
Description: Provides up to 75% in funding for a variety of school safety measures in and around K-12 schools and grounds, including:
Coordination with law enforcement
Training for local law enforcement officers to prevent student violence against others and self
Metal detectors, locks, lighting, and other deterrent measures
Technology for expedited notification of local law enforcement during an emergency, or any other measures that the COPS Office determines may provide a significant improvement in security
Homeland Security Grant Program (HSGP)
Due Date: Eligible Applicants are advised to contact their State Administration Agency (SAA) if interested in grant funding
Eligibility: State, local, tribal, and territorial governments, as well as nonprofits (subrecipients)
Description: Allowable expenses include materials to conduct planning, engagement, and volunteer management activities; interoperable communications equipment; measures to increase physical security; training conferences; and more.
State HSGP
Due Date: Contact SAA for application dates and eligibility requirements
Eligibility: Local law enforcement, as well as nonprofits (subrecipients)
Description: Administered by FEMA, the SHSP is part of the broader Homeland Security Grant Program (HSGP). It provides funding to state, local, tribal, and territorial governments to enhance their ability to prevent, protect against, respond to, and recover from terrorist attacks and other emergencies. You must apply through your State Administrative Agency (SAA) and cannot apply directly to FEMA. Not all states permit schools to apply, so check with your SAA for more details. Funds are allocated based on risk assessments and the effectiveness of proposed initiatives.
Key focus areas: Planning, Equipment Acquisition, Training and Exercises
Nonprofit Security Grant Program (NSGP)
Due Date: Contact your State Administrative Agency (SAA), Homeland Security Grants Division
Description: Allowable expenses include identification, assessment, and reporting of threats of violence; improving cybersecurity of access control, identity verification systems, and security technologies; security training for employees; and more.
Description: A core component of the 2022 Bipartisan Safer Communities Act, the SCGP provides funding for local communities and leaders to improve schools’ climate and student achievement. The program awards funds to local education authorities that integrate evidence-based approaches to safe, supportive, and healthy schools. These can include security measures, wellness initiatives, safety planning and associated school safety training.
Because many FY26 deadlines have not yet been confirmed, districts should monitor prior-year grant cycles, SchoolSafety.gov, and Grants.gov for updates.
Federal responsibility for some school safety and recovery programs may also shift. Reports indicate that agencies such as the Department of Health and Human Services could take on a larger role in administering grants connected to mental health, school recovery, and violence response, including Project SERV.
State & Non-Federal Funding Pathways
In Massachusetts, the Department of Elementary and Secondary Education administers roughly $6 billion in education funding, with approximately 98% flowing directly to districts through local aid, grants, and reimbursements.
Beyond Chapter 70, districts can pursue targeted programs such as:
FY2025 Rethinking Discipline Initiative
FY2026 Safe and Supportive Schools Competitive Grant
These grants support school climate, student intervention, behavioral supports, and technology-driven systems that help identify and assist at-risk students.
Alyssa’s Law in Massachusetts
Massachusetts lawmakers are currently considering legislation related to Alyssa’s Law, which would require schools to implement silent panic alarm systems and related emergency response protocols.
If enacted, districts could deploy those tools through smartphone apps, wearable alert devices, or fixed panic alarm hardware. The legislation remains pending, but the broader movement toward rapid-response safety tools continue to grow nationwide.
Applying Strategically
Competitive grants reward clarity and preparation. Strong applications typically connect four elements:
Districts that clearly tie funding requests to safety, operational efficiency, and student outcomes tend to be better positioned for success.
Kokomo24/7® works with districts to align school safety goals with available funding opportunities, including grant identification, planning support, and strategy development.
The Outlook for FY26 and Beyond
Massachusetts enters FY26 with relatively strong state and local support compared with many other states. Even so, districts still face a planning environment shaped by policy complexity, evolving federal roles, and growing operational expectations.
School systems that diversify funding sources, track policy shifts closely, and move early on grant opportunities will be in a stronger position to support safety, innovation, and student success in FY26 and beyond.
K–12 funding will remain a central issue across the education sector. Strong planning, disciplined financial management, and the right partnerships continue to matter.
About Kokomo24/7®
Kokomo Solutions, Inc. (Kokomo24/7®) is an enterprise B2B software company founded and based in Chicago, IL featuring a flexible software platform with proven solutions around health, safety, and operational use cases serving over 100 enterprise clients, including many education institutions, corporations, and municipalities.
Kokomo24/7® offers schools and workplaces a holistic platform for health, safety, and operational efficiency. Most organizations are inundated with fragmented solutions and struggle to provide streamlined services. Adopt a platform that can grow with you.
 CASES™
 ESCALATE™
 TRIAGE™
 NOTIFY™
 FORMS™
 ANALYTICS™
 HOST™
HOST™ OWLPASS®
 ACCESS™
 WELLNESS™
 CREDENTIALS™