According to a US Secret Service report,[1] one-third of attackers who terrorized schools, houses of worship or businesses nationwide in 2018 had a history of serious domestic violence, two-thirds had mental health issues, and nearly all had made threatening or concerning communications that worried others before they acted out. Reporting and intervention are key to preventing school shootings, bullying, and other safety concerns. With predictive analytics from data stored within Student Information Systems (SIS), schools can analyze student safety data to anticipate events and provide more precise intervention. The Los Angeles Unified School District (LAUSD) which is home to more than 700,000 students and 850 schools, is using predictive analyses as part of their strategic graduation plan with the hope of ensuring a 100% graduation rate.
Most schools already have a SIS in place to record student data related to scheduling, attendance, grades, and discipline, but these systems were never intended for managing student safety and compliance concerns in accordance with local, state, and federal mandates. Today’s glut of standard incident management systems log and manage incidents, but only record incidents after they have occurred. By the time an incident such as a missed class, an instance of bullying, or even an episode of violence ends up in the system, it’s too late. With predictive analytics, schools can use the data they already have to identify safety patterns that could indicate future school violence, performance issues, and bullying. Predictive analytics leverages statistics, data modeling/mining, machine learning and A.I. and then correlates the historical data to list the probability of an event to happen in the future. Instead of looking backwards at trends, predictive analytics combines historical and current data data and in real time, looks at areas where potential interventions should take place. In a large school district such as the LAUSD, incident data from hundreds of schools can be used to accurately identify red flags and notify school administrators of potentially unsafe incidents on the horizon.
Download our “SIS Isn’t Student Safety” whitepaper to learn more.
But you need a good data model and some automation to make it work. No human (or even group of them) can sift through years of incidents and correlate the data to identify patterns of bullying and violence in a school system with nearly 800,000 students and over 1 million citizens. And this is where letting the data work comes into play. If a school district could take all the incidents in a SIS, correlate anonymous tips from hundreds of thousands of citizens, then include incident data from social media posts and put it into a data model that could deliver with some level of accuracy the probability of incident, we’d be hearing more school intervention stories and educators could focus more on learning.
A recent CDC report reveals that more than 21% of students reported missing school due to safety concerns of bullying and cyberbullying.[2] And missing school correlates directly to graduation rates. A recent Johns Hopkins University report, “The Importance of Being in School,” found that in the state of Georgia high school students who missed 0 to 5 days of school saw a 50-percentage point increase in graduation rate than peers who were absent 15 or more days.[3] Letting the SIS data work through the predictive models brings greater visibility to administrators and resource officials to see the potential for trouble in an automated fashion. Alerts and reports can be generated that tell the true story of school safety, so educators spend less time reacting to trouble and more time focusing on graduating students.
Incident Decision Support from Kokomo24/7® Safety Cloud™ for Proactive Intervention
Kokmo24/7® Safety Cloud™ turns SIS data into actionable insights by looking at the relationship between dozens of incident types and correlating them as events to reveal patterns of behavior indicative of an unsafe student event. The solution then visualizes the intelligence into a “likelihood burst chart” by school location so administrators and resource officials can better understand the potential for unsafe incidents.
The LAUSD deployed Kokomo24/7® Safety Cloud™ in late 2019 with the goal of providing a modern, technology-driven safety solution leveraging existing SIS data to better understand incident threat for its more than 700,000 students. The intelligent data model used at LAUSD was built with more than 300,000 incidents across a span of nearly 10 years. Almost immediately upon putting the solution into production, the data in Kokomo24/7® Safety Cloud™ was painting a picture of school safety within the LAUSD school district. At any school district where a SIS or similar student tracking tool is in use, Safety Cloud™ can take advantage of the built-in data modeling to better understand at risk schools and students for unsafe safety incidents.
 CASES™
 ESCALATE™
 TRIAGE™
 NOTIFY™
 FORMS™
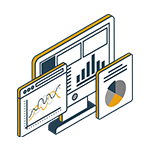 ANALYTICS™
 HOST™
HOST™ OWLPASS®
 ACCESS™
 WELLNESS™
 CREDENTIALS™